

What you can’t measure you can’t improve!
The Beginning and how I started
That is a common phrase that we use when are in situations like in front of clients or explaining a problem. And it is true, to improve something you have to apply some metodology and to apply that metodology you have to have information, in other ways, called data.
Data Scientists rely on data to do their insights at first and in the end do a probabilistic or predictive or time series model (talking only on data models). You could apply simple statistics to complex deep learning methodology to make the model predict your labels if you are using supervised learning .
Before explaining more about how we will do the Chicago analysis I will talk about how I started on Data Science and other fields.
I’ve been always hungry of knowledge and also like to do things myself if I could, not just only to understand the path but also to make some regular projects that build my skillset. Firstly, I am an Electromechanical Engineer and we are not taught to program so at the beginning, started with C/C++ programming and Embedded Systems since 2002. On the other hand I discover Computer Vision and started to experiment on that field with OpenCV.
Then I discover other paths and also other tools needed, for example, in web development; HTML, CSS, Javascript but I know a little about it. Continued with Embedded Linux on 2006, robotics in 2007 with the new framework of robotics called ROS and finally between 2014 up to know discover more interesting fields like Data Science, Machine Learning, Deep Learning, Computer Vision (now ML/DL applied) and robustness in Robotics.
Now that you know a little bit about my past, let me finish to telling you it is a long and hard path, you will not finish to learn and also all the paths in one way and another helped me not only to understand the world but also continuing to improve my demand in the market, so, it is also, for me, a marketing tool to get new job offers.
Crime Analysis – The Dataset
There are two different sources that you can get the dataset. One is the default database of Crimes of Chicago for the open government initiative in data.gov and the other is Kaggle. I prefer the first one because is updated for every period with all data over time.
The dataset then consists of several parameters:
| ID | Unique identifier for the record. |
| Case Number | The Chicago Police Department RD Number (Records Division Number), which is unique to the incident. |
| Date | Date when the incident occurred. this is sometimes a best estimate. |
| Block | The partially redacted address where the incident occurred, placing it on the same block as the actual address. |
| IUCR | The Illinois Unifrom Crime Reporting code. This is directly linked to the Primary Type and Description. See the list of |
| Primary Type | The primary description of the IUCR code. |
| Description | The secondary description of the IUCR code, a subcategory of the primary description. |
| Location Description | Description of the location where the incident occurred. |
| Arrest | Indicates whether an arrest was made. |
| Domestic | Indicates whether the incident was domestic-related as defined by the Illinois Domestic Violence Act. |
| Beat | Indicates the beat where the incident occurred. A beat is the smallest police geographic area – each beat has a dedicated |
| District | Indicates the police district where the incident occurred. See the districts at https://data.cityofchicago. |
| Ward | The ward (City Council district) where the incident occurred. See the wards at https://data.cityofchicago. |
| Community Area | Indicates the community area where the incident occurred. Chicago has 77 community areas. See the community areas at https://data.cityofchicago |
| FBI Code | Indicates the crime classification as outlined in the FBI’s National Incident-Based Reporting System (NIBRS). |
| X Coordinate | The x coordinate of the location where the incident occurred in State Plane Illinois East NAD 1983 projection. |
| Y Coordinate | The y coordinate of the location where the incident occurred in State Plane Illinois East NAD 1983 projection. |
| Year | Year the incident occurred. |
| Updated On | Date and time the record was last updated. |
| Latitude | The latitude of the location where the incident occurred. |
| Longitude | The longitude of the location where the incident occurred. |
| Location | The location where the incident occurred in a format that allows for creation of maps and other geographic. |
Crime Analysis – The Facts
Which type of crimes are the mos frequent?
After some data cleaning, we can start with the data itself to see insights. Insights is an important part of a data scientist job because we can have clues about the data. Below we will see a graph of the current and previous year.
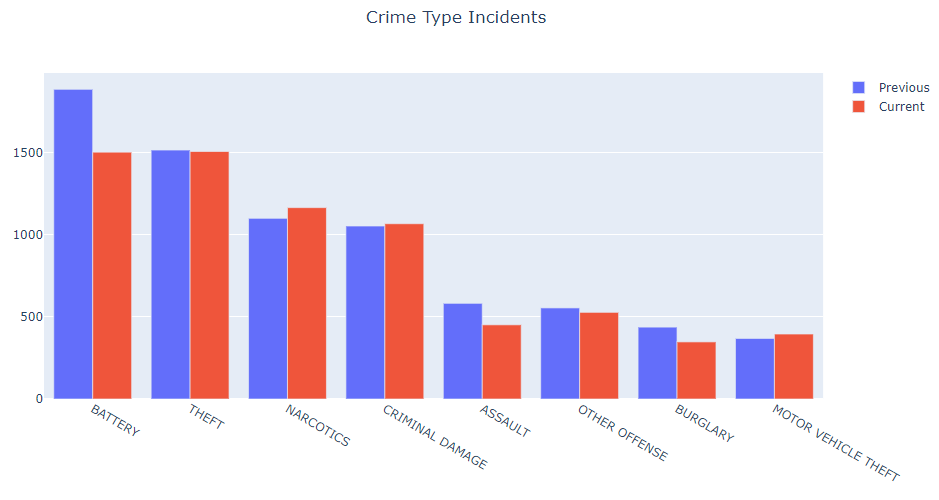
We can see above that the most frequent crime of that season was battery and next theft. This is obvious because are most common crimes that happens to people in streets, including narcotics. For example, you will not see in this list crimes related to home abuse of women because is not as frequent (in quantity) as the mentioned above.
Other thing to note is that we can see an improvement of the police department generally speaking, so let’s say the corrective approach of the police department over the year improved the scenarios of most conflicts.
Which are the days that most of the crimes have been done?
Now let’s take a look about the total crimes occurred over the period of April 2 to April 9 of 2006.
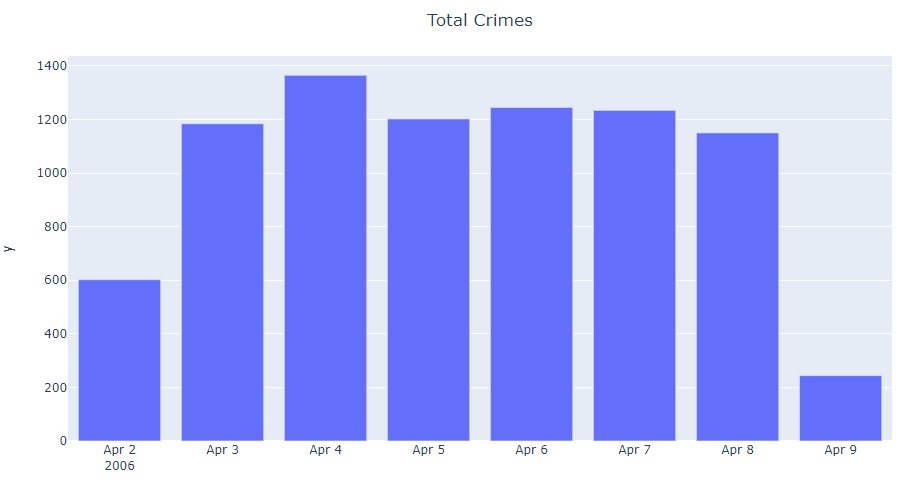
Which is the day of most incidents?
In the previous figure we saw that April 4th is the most incident or frequent day. April 4th was Tuesday, that is only what we now, there is no much information of why was this day nor the times or anything else, but is good to know that we must press these days. Also, approaching the weekend we have a high incident of crime rates, so we must take care about that situations too.
A radar graph could give us a better estimate, let’s see below.
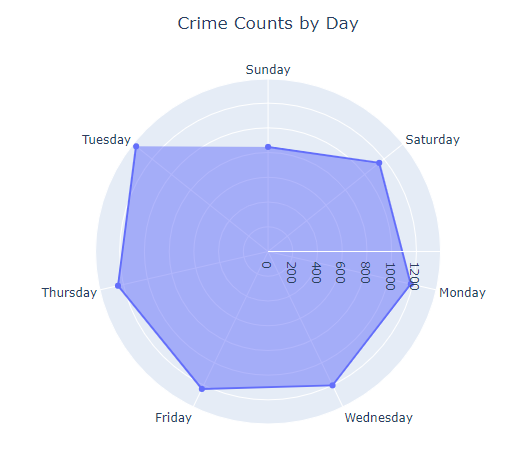
As we noted above, Tuesday was the day with most crimes, and is remarked in the radar graph. Radar graphs are usefull for fast insights and are very common in sport games, for example footbal soccer.
Can we summarize in a better graph?
Now let’s mix the graphs of day and frequencies using a heatmap.
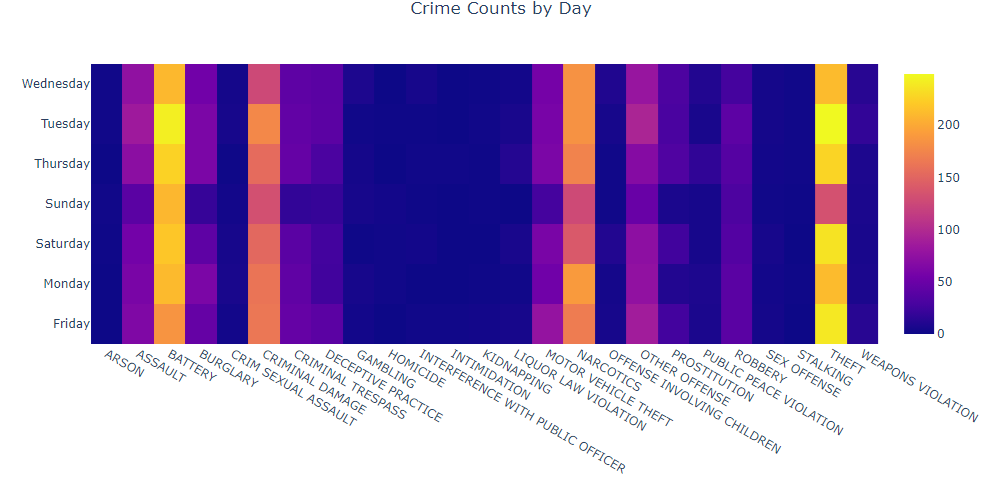
Now in the above picture we have a panoramic of not only the crimes occupancy over the week but also the intensities. In this case yellow is the most intense crime rate and dark blue is the less intense one.
Finally we can view tha crime rates in a table for a better comparison of change.
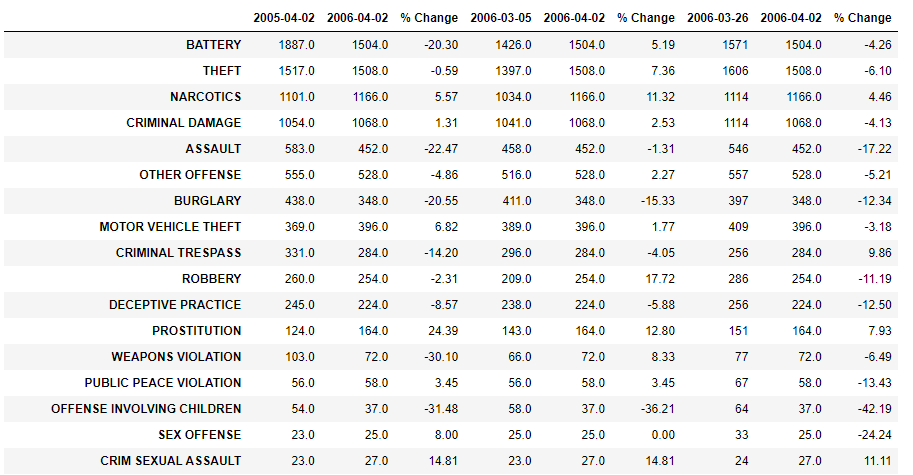
On the table above we saw the same 2005 and 2006 changes but, this table gives us more insights about the current year, month and week vs the previous year, month and week. We saw that practically all the crimes where in decrement over the periods of time, some others like prostitution needs to be hard worked on the streets but in general the police department of Chicago do a good job.
Crime Analysis – Conclusions
As we say, the work of a Data Scientist is more than only the machine learning part. Also, the supplied dataset is not cleaned, probably we have to do a lot of work of cleaning and creation of new variables to validate a good model.
In this part of the blog we only discussed the insights of a period of time but for better insights we must explode the power of data. For this dataset from the city of Chicago we only developed simple ETL and basic insights and for visualization we used plotly.
Practically a Data Scientist job is more like 80% in this part about cleaning and insights and less than 20% in the model preparation.
Appart of Battery, theft has the higher number of incidents and is -.59% from the previous year.
8226 incidents happened during this period and is -6.65% from the previous rate year.
Monday is the most number of incidents of theft, but Tuesday for Battery
Most of the crimes, if we get an insight of time occurs during 12PM of the selected period.
Finally we can say, personally speaking that this part before of the machine learning pipeline is very time consuming but really helpful and interesting when you saw the graphs for the first time, every graph is a delight to the eye and are beautiful for your brain thinking. Data Sciences is a progressive field that has a lot of time in the industry but nowadays is very critical because the use of AI and ML to generate predictions to do decision making.
Post a Comment